
Scripts - Reference
Summary:
Basics of Scripts, and reference details for the ProSEM classes and functions available in scripts, as well as the common libraries that are included with the ProSEM Python instance.
Jump to: Properties: Project, Image, Group, Gratings, Arrays, Generic to All Measurements, Line/Space, Circle/Ellipse, Rectangle, Triangle, SingleEdge, Shape, Multi-Edge
Included Libraries
In addition to the Python Standard Library, ProSEM also includes several useful libraries.
(Links open documentation pages for each library in a new browser window.)
|
Library Name |
Description |
|---|---|
| Extended parsing and processing of date and time strings | |
| matplotlib & mpl_toolkits | Draw many types of plots, with extensive controls & options |
| numpy | Numerical processing library |
| PIL (Python Imaging Library) | Image processing library |
| wx |
GUI widgets toolkit, for dialogs for user input in scripts |
| xlsxwriter | For writing Excel format files in the .xlsx format |
|
For writing older format Excel files in the .xls file format |
Metrology Classes
Measurements must be an instance of one of these classes:
- GMetrologyLinesSpaces
- GMetrologyCircle
- GMetrologyEllipse
- GMetrologyRectangle
- GMetrologyTriangle
- GMetrologyShape
- GMetrologySingleEdge
- GMetrologyMultiEdge
The Python isinstanceof(object,type) function can be used to test for an object type. Example:
Example to test if item is a Lines&Spaces measurement: if (isinstance(item,GMetrologyLinesSpaces)):
Accessing Measurement Data, Properties and Functions
When writing scripts for ProSEM, context is key; specifically, all measurement data in ProSEM is stored in a hierarchy, and thus must be accessed within that hierarchy.
ProSEM Project --> Image(s) --> Group(s) --> Measurement(s)
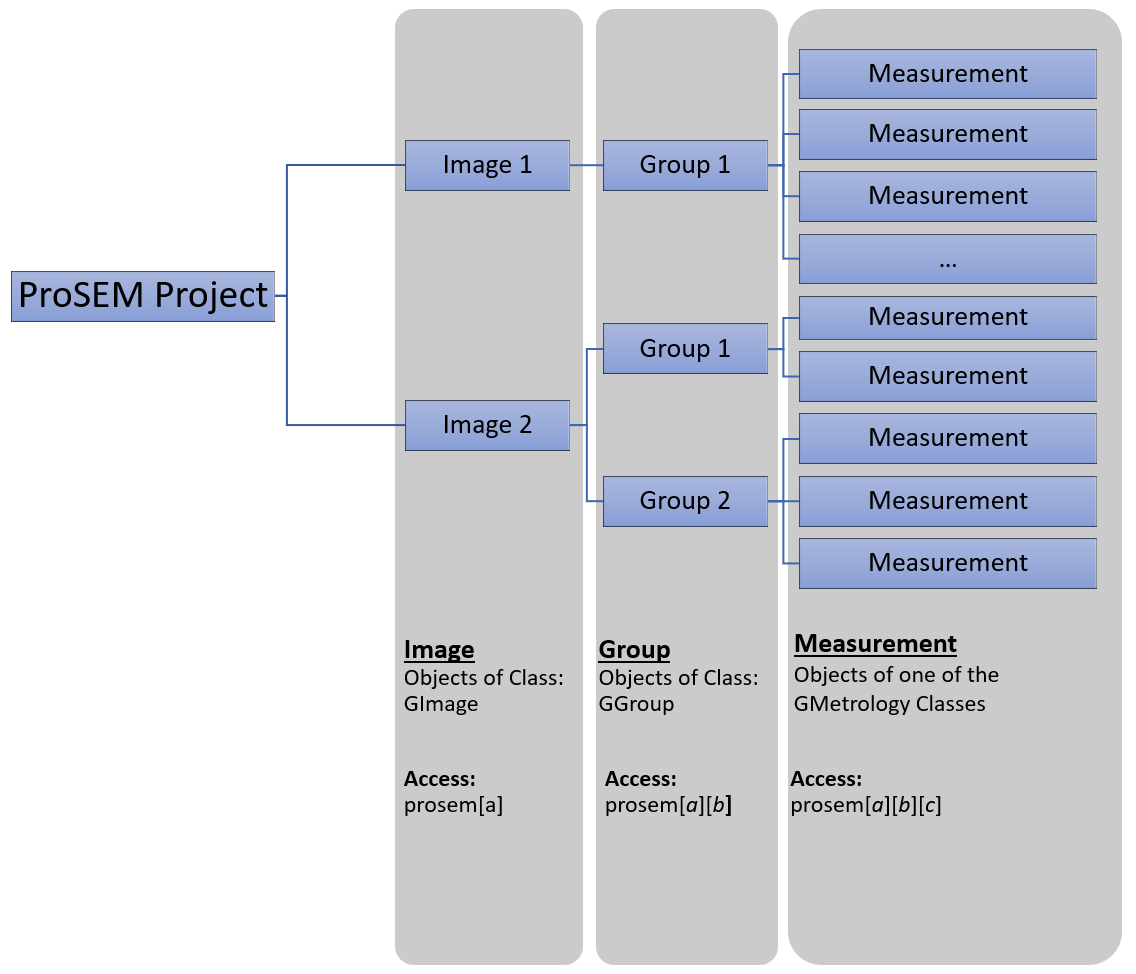
Items can be accessed by index, starting from 0. Some examples:
prosem[0] the first image in a projectprosem[2][1] the second group in the third image in the projectprosem[1][0][4] the fifth measurement in the first group in the second image
so any attribute of an item is available:prosem.base C:\Users\me\Documents\
prosem[0].file C:\Users\me\Documents\AB0223.tif full path of the first image in the projectprosem[0].label AB0223 the label of the first image in ProSEM (filename modified as needed so that it can be used as a property name.
prosem[1][2].label Rectangles the name of the third group in the second image in this project
If it is necessary to find the index of an object by a property value, this code is useful:
imageName = 'PhotXtal_1' # find the index of the image with this namecontext = prosem # by looking in the project index = next((i for i, item in enumerate(context) if item.label == imageName),ValueError)if (index == ValueError): print('Error: item label not found in project.')else: ...
Or to find the index of the group named 'Circles & Ellipses' in an image:
context = prosem[2] # search in the third image in the projectgroupName = 'Circles & Ellipses' # for the index of the group of Circles & Ellipses
index = next((i for i, item in enumerate(context) if item.label == groupName),ValueError)
print(prosem[2][index][0].MajorDiameter)251.548
Note that in both examples, it is important to check that the index is valid, that is, that the item sought actually exists, by checking that the return is not ValueError.
Project Properties, Functions, and Methods
Examples here assume a ProSEM project, ie a GProSEM object is instanced with the name prosem
| Name | Kind | Description | Example Example Result |
Notes |
|---|---|---|---|---|
| len | Function | Count of images in the project |
3 |
There are three images in this project |
| file | Attribute | Full path of the ProSEM project file |
|
The full path of the project file. Within a script called from interactive ProSEM, this is the temporary project passed to ProSEM, not the project open in the interactive ProSEM instance. |
| base | Attribute | The directory where the currently loaded project resides |
|
Similar to file (above), but only the path, without the project filename, |
| MeasurementUnit | Attribute | User units of the current project, either 'nm' or 'um' |
|
Possible values are: |
|
version |
Attribute | Version number of ProSEM |
v2.8.3 |
|
|
load_project(path) |
Method | Loads a project from a file |
Loads this project into the ProSEM scripting environment |
This replaces an existing project in the scripting environment without warning. If, at script conclusion, this is passed back to the interactive ProSEM session, then the project that was open in the interactive session prior to the script call will be replaced as well. |
| save_project(path=None) |
Method | Save the project to a file |
Saves the project in the ProSEM scripting environment to the specified file, |
If no filepath/filename is given, the saved project is updates the project file that was loaded into the ProSEM scripting environment |
| add_image(path) |
Method | Add an image file to the current project, or create a new project containing just one image. |
Loads this iamge into the project in the ProSEM scripting environment |
|
| add_folder(path) |
Method | Add a folder of images to the current project, or create a new project containing images from a folder. |
Load images in the specified folder into the project in the ProSEM scripting environment |
|
|
load_recipe(path) |
Method | Load a recipe from a file. |
Loads the recipe into the project in the ProSEM scripting environment |
|
|
save_recipe(path) |
Method | Save the current recipe to a file. |
Saves the recipe currently in the ProSEM scripting environment to the specified file. |
Silently overwrites an existing file with the same path/name |
|
selection |
Attribute | Object selected in the project Images Panel |
ProSEMpy.GImage object
'MyFilename_21' |
The object that was selected at the time the script was called. Could get an Image, a Group, or a stored Measurement |
|
result_table_names |
Attribute | A list of all Result Tables in the project |
['Lines & Spaces', 'Shapes', 'Triangles'] |
Result Tables only exist in a project if there are stored objects of that feature type |
|
group_table_names |
Attribute | A list of all Group Tables in the project |
['Lines & Spaces', 'Circles & Ellipses'] |
Group Tables only exist in a project if there are Gratings or Arrays of object of a specified data type. In this example, the project has both Line/Space Gratings and array of Circles/Ellipses |
|
summary_table_names |
Attribute | A list of all Summary Tables in a project |
prosem.summary_table_names ['My Example Summary'] |
Summary Tables only exist if they have been created in a project |
|
result_table(name) |
Attribute | The full contents of the specified Result Table |
|
Returns a list of lists, where each subordinate list has the contents of each row in the Result Table, with the first list being the data column headers for that table. |
|
group_table(name) |
Attribute | The full contents of the specified Group Table |
[['Image', 'Group ID', 'Col Vector X[nm]', 'Col Vector Y[nm]', 'Row Vector X[nm]', 'Row Vector Y[nm]', 'Radial Jitter[nm]', 'Col Jitter[nm]', 'Row Jitter[nm]', ... ], ['Q3__Array_Hex', 'Group_1', '452.9', '-2.8', '218.5', '390.0', '1.8', '1.5', '1.5', '6', ...]] |
Returns a list of lists, where each subordinate list has the contents of each row in the Group Table, with the first list being the data column headers for that table. |
|
summary_table(name) |
Attribute | The full contents of the specified Summary Table |
[['Image', 'N', 'Mean of CD Mean[nm]', 'StdDev of CD Mean[nm]'], ['A__Metal_Lines', '3', '239.9', '192.5'], ['C__Negative_Resist_Nanoscale', '3', '40.7', '0.5'], ['F__Grating_Etched_In_InP_238nm_period', '12', '112.0', '2.3']]
|
Returns a list of lists, where each subordinate list has the contents of each row in the Summary Table, with the first list being the data column headers for that table. |
Image Properties, Functions, and Methods
Examples assume: prosem is a GProSEM object, and image is a GImage object within that project.
| Name | Kind | Description | Example Example Result |
Notes |
|---|---|---|---|---|
| len | Function | Count of Groups in the image |
1 |
The image has one group of measurements. |
| CountX CountY |
Attribute | Number of pixels in the image in X or Y |
|
Return value is type float |
| PixelSize | Writable Attribute | The pixel size of the image, in user units |
The pixel size of the second image in the project is set to 3.14159 user units |
The This is a writable attribute, so the pixel size of an image can be changed by assignment. |
| Rotation | Attribute | Rotation of the image |
|
Normally 0; is otherwise if the image has been rotated using the rotate method |
|
SizeX |
Attribute | The dimensions of the SEM image, in user units. |
3996.875 |
This is computed for the total image, if a portion of the image is a data bar or border, that space will be included in this value, so the actual displayed image area may be less that this Size |
|
label |
Attribute | The Name of the image file in ProSEM |
My_Image_Name |
This is set to the filename of the image, but with Python special characters replaced with underscores, so that this can be used as a property name. This label can also be changed in ProSEM Images panel, so it is not necessarily the name of the image file. |
| file | Attribute | The full file path and filename of the image file |
"/home/direc/imageFileName.tif" |
Functions in the standard python OS.path library can be very helpful to parse this, for example to extract the filename and extension: |
| length |
Attribute | Count of the number of groups in the image |
2.0 |
This property is a float type |
| metadata | Attribute | A Python dictionary holding SEM metadata for the image, if it exists |
33
['MODE','SCALE','MAG','STAGEX','STAGEY']
'100000' |
Metadata stored in or with SEM images depends completely on the SEM tool vendor and model. The first example uses the The second example uses the The third example returns the value of the metadata item named "MAG". |
|
rotate(angle, copy) |
Method | Rotates image by the given angle |
Rotates the image by 45 degrees, modifying the image in-place in ProSEM, not creating a copy. |
The modified image is only within ProSEM; the image file is not modified by ProSEM. |
|
export_item(item, path, width, height, scale) |
Method | Saves the measured image to a file, with overlays as displayed on the screen. |
|
Silently overwrites an existing file with the same path/name. |
Group Properties, Functions, and Methods
Examples assume: prosem is a GProSEM object, image is a GImage object within that project, and group is a GGroup object within that image.
The properties available depend on the type of group, a generic group of measurements, a grating (a group of adjacent line/space measurements), or an array (a group of 2-dimensional objects in a 2-dimensional layout).
Generic Groups
| Name | Kind | Description | Example Example Result |
Notes |
|---|---|---|---|---|
| len | Function | Count of measurements in the group |
4 |
The group has four measurements. Return value is an integer |
|
GroupID or label |
Attribute | The name of the group |
|
Return value is a string. |
| IsArray | Attribute | Is this group an Array? |
|
Test if the objects in this group have an array fit. If True, array fit parameters are available; see below. |
| IsGrating | Attribute | Is this group a Grating? |
prosem[1][1].IsGrating == True group.IsGrating == True |
Test if the objects in this group have a grating fit. If True, grating fit parameters are available; see below. |
|
EdgeProfileFitQuality |
Attribute | The average of the Edge Fit Quality score for measurements in this group |
0.8794 |
The return value is a float between 0 and 1.0 |
|
FeatureFitQuality |
Attribute | The average of the Feature Fit Quality score for measurements in this group |
0.8998 |
The return value is a float between 0 and 1.0 |
| image | Attribute | The GImage object which is the parent of this group |
|
|
| length |
Attribute | Count of the number of measurements in this group |
8.0 |
This property is a float type |
|
export_image(path, width, height, scale) |
Method | Saves the measured image to a file, with overlays as displayed on the screen. |
|
Silently overwrites an existing file with the same path/name. |
Grating Groups
| Name | Kind | Description | Example Example Result |
Notes |
|---|---|---|---|---|
| GratingPitchMean GratingPitchStdDev GratingPitchMin GratingPitchMax |
Attribute | Statistics for Pitch measurements |
|
Grating pitch is measured from each rising edge to the adjacent rising edge, and each falling edge to the adjacent falling edge |
|
GratingLineMean |
Attribute | Statistics for Line measurements |
|
|
| GratingTrenchMean GratingTrenchStdDev GratingTrenchMin GratingTrenchMax |
Attribute | Statistics for Line measurements |
8.0 |
This property is a float type |
Array Groups
| Name | Kind | Description | Example Example Result |
Notes |
|---|---|---|---|---|
|
ColVectorX |
Attribute | Vector Dimensions of a unit cell of the fitted array |
|
Grating pitch is measured from each rising edge to the adjacent rising edge, and each falling edge to the adjacent falling edge |
|
ColJitter |
Attribute | Mean Jitter for elements in the group |
|
Jitter is the distance of the object center from the fitted array point, given as components along the row and column vectors, as well as the radial distance from the fitted array point |
|
MeanofArea |
Attribute | Statistics for the enclosed area and fitted area for the shapes in the array |
|
|
|
MeanofBBoxHeight |
Attribute | Average dimensions of the measurement bounding box (extreme points) |
|
The shape BBox encloses all edge points in the measured shape, so these dimensions reveal the most outlying points in each dimension |
| MissingFeatures
|
|
|
||
|
MeanofMajorDiameter |
Attribute |
Arrays of Circles and Ellipses Only Statistics for measured circles and ellipses in the array |
|
|
|
MeanofHeight |
Attribute |
Arrays of Rectangles Only Statistics for fitted rectangles in the array |
|
|
|
MeanofEdgeAngle1 MeanofEdgeAngle2 MeanofEdgeAngle3 MeanofEdgeLength1 MeanofEdgeLength2 MeanofEdgeLength3 MeanofInteriorAngle1 MeanofInteriorAngle2 MeanofInteriorAngle3 StdDevofEdgeAngle1 StdDevofEdgeAngle2 StdDevofEdgeAngle3 StdDevofEdgeLength1 StdDevofEdgeLength2 StdDevofEdgeLength3 StdDevofInteriorAngle1 StdDevofInteriorAngle2 StdDevofInteriorAngle3 |
Attribute |
Arrays of Triangles Only Statistics for fitted triangles in the array |
|
|
Measurement Properties, Functions, and Methods
Examples assume: prosem is a GProSEM object, image is a GImage object within that project, group is a GGroup object within that image, and meas is a stored measurement object within that group of one of the GMetrology... classes. (list above.)
The properties available depend on the object type of measurement.
Generic Measurement Properties & Methods for All Feature Types
These properties and methods apply to all of the individual Feature Types described below.
| Name | Kind | Description | Example Example Result |
Notes |
|---|---|---|---|---|
|
group |
Attribute | The group object this measurement belongs to |
prosem[0][0][0].group |
Return value is a GGroup object, for the group that contains this measurement. |
| image | Attribute | The image object this measurement belongs to |
prosem[1][1][0].image
|
Return value is a GImage object, for the image that contains this measurement. |
| validationstate | Writable Attribute | Validation Status, one of:
Validated |
|
Return value is a string. When setting a value, the assignment is permissive; not case sensitive and can be shortened to the least ambiguous string, for example 's' --> 'Success'. |
|
outline |
Method | Access to all edge points in the measurement |
|
For Line/Space measurements, a required parameter specifies which edge, 0 or 1. The Outline object can be subscripted to access an individual edge point, indexed from 0 to len-1. The Point object can be subscripted to access the X or Y coordinates, indexed 0 or 1, respectively. |
|
label |
Attribute | The name of the measurement ProSEM |
'M_12' |
|
|
EdgeProfileFitQuality |
Attribute | Quality Score for how well edge fit method (e.g. Sigmoid) fit the edge signal |
>>> a.EdgeProfileFitQuality |
Quality Scores range from 0.0 to 1.0 |
|
FeatureFitQuality |
Attribute | Quality Score for how well the measured edge points fit the chosen feature (e.g. Line, Circle, Rectangle) |
>>> a.FeatureFitQuality |
Quality Scores range from 0.0 to 1.0 |
|
FeatureFindQuality |
Attribute | Quality Score for how well the feature matches the template feature for a Find Similar or Batch Find operation |
>>> a.FeatureFindQuality |
Quality Scores range from 0.0 to 1.0 |
|
export_image(path, width, height, scale) |
Method | Saves an image of the measurement ROI to a file, with overlays as displayed on the screen. |
|
Silently overwrites an existing file with the same path/name. |
|
distance_fitted_feature(a,b) |
Method | Compute the shortest distance between the fitted features of two measurements. |
|
Returns the nearest distance (in user units) between the fittted features of the two measurements given. |
|
distance_nearest_points(a,b) |
Method | Compute the distance between the closest points detected in two measurements. |
|
Returns the nearest distance (in user units) between the closest measurement points of the two measurements given. |
| compute_cd(a, b, output)
|
Method | Compute the distance between two line measurements by averaging over line to point distances. |
|
Optional 'output' argument determines the statistical property to return: "mean" (the default), "median", "min", "max", "range", "stddev", or "rms". |
| Input Parameters |
|
|
||
|
LLX LLY URX URY |
Attribute | Extents of the ROI containing this measurement. |
|
X and Y coordinates of the Lower Left (LL) and Upper Right (UR) corners of the Region of Interest |
| AutoContrast | Attribute | Now obsolete |
|
If autocontrast was enabled (now obsolete) |
| FilterType GaussX GaussY |
Attribute | Image Pre-processing Filter Used, and parameters |
>>> a.FilterType |
Filter Type values include: No Filter, Gaussian, Nagao-Matsuyama, Sym-Nearest-Neighbor, Median. The GaussX and GaussY properties only apply when the FilterType=Gaussian; for other types, the value is 'N.A.' |
| LineScanAvg | Attribute | Number of scan lines averaged during image preprocessing |
Default is 0 |
|
| EdgeMode | Attribute | Edge Finding method applied for this measurement |
>>> a.EdgeMode
|
All Feature Types: Automatic, Canny, and Slope Analysis Circle, Line/Space: Manual 2-D Shapes: Correlation |
| FineMode CdPos |
Attribute | The edge fitting method used and the signal location on the edge used to define the edge point |
>>> a.FineMode |
The available values for fit mode depend on the chosen edge position. Top: Sigmoidal Fit, Parabolic Peak Mid: Sigmoidal Fit, Max Slope Bottom: Sigmoidal Fit, Regression To Baseline When Position is set to Custom Signal Level, the CdPos property as the signal level percentage FineMode = Threshold also used the defined CdPos value for the threshold |
| TwoPassMeasurement | Attribute | Did measurement use Two-Pass refinement? |
>>> a.TwoPassMeasurement |
currently: Line/Space only |
Feature Type: Line/Space
A Line/Space Feature Type is defined as two edges, so there are some unique properties specific to each edge, as well as some properties that encompass both edges. The individual edges are addressed as E0 and E1, where E0 is the left or bottom edge, and E1 is the right or upper edge.
All of the Generic Measurement Properties and Methods apply.
| Name | Contents | Example | Notes |
|
CDMean CDSampleCount |
CD Measurement results. The Mean, Maximum, Minimum, Median, Standard Deviation, and Count of the individual CD measurements in the feature. |
>>> a = prosem[0][0][0] >>> a.CDMean |
In user units, nm or um
All properties, including CDSampleCount, are type float. |
|
CenterX |
Geometric center of all edge points in both edges of the feature |
>>> a.CenterX |
In user units, nm or um, with the origin at the image lower-left corner
|
|
E0Angle |
Geometric data about each edge in the Line/Trench feature: Angle with respect to horizontal X-Axis |
>>> a.E0Angle |
In degrees, with respect to the horizontal axis, positive X = 0 degrees
|
|
E0CenterX |
Geometric data about each edge in the Line/Trench feature: Geometric center of individual edges |
>>> a.E0CenterX |
In user units, nm or um, with the origin at the image lower-left corner
|
|
EdgeProfileFitQuality |
Edge fitting metrics, for the feature, and for each edge |
>>> a.EdgeProfileFitQuality |
All quality metrics are between 0.0 and 1.0 |
|
FeatureFitQuality |
Feature (Line) fitting metrics, for the feature, and for each edge |
>>> a.FeatureFitQuality |
All quality metrics are between 0.0 and 1.0 |
|
E0FitErrorMean |
Mean and Standard Deviation of the edge fit errors for each edge |
>>> a.E1FitErrorMean |
In user units, um or nm. |
|
E0LER3StdDev E1LER3StdDev |
Line Edge Roughness metrics for each edge in the Line/Trench feature |
>>> a.E0LER3StdDev |
In user units, nm or um
Only available when LER has been measured for the feature
|
| LWR3StdDev LWRCorrelationLengthXi LWRRoughnessExponentAlpha |
Line Width Roughness metrics for the Line/Trench |
>>> a.LWR3StdDev |
In user units, nm or um
Only available when LER has been measured for the feature
|
Feature Type: Circle/Ellipse
All of the Generic Measurement Properties and Methods apply.
|
Name |
Contents |
Example |
Notes |
|
MajorDiameter AspectRatio |
Circle/Ellipse Measurement results For a circle type, the Major and Minor axes are always equal, and Aspect Ratio = 1.0 |
>>> a = prosem[1][0][0] |
In user units, nm or um
|
|
MajorAxisDirection |
Circle/Ellipse Measurement results: The angle of the major axis |
|
In degrees, with respect to the horizontal axis, positive X = 0 degrees
|
|
Area |
The area bounded by the traced shape, and by the fitted circle or ellipse shape | >>> a.Area 246190.5182436655 >>> a.FittedArea 247547.06877563742 |
In square user units, nm2 or um2
|
|
CenterX |
Center of the fitted circle/ellipse | >>> a.CenterX 3157.941292765046 >>> a.CenterY 2016.7030498969368 |
In user units, nm or um, with the origin at the image lower-left corner
|
Feature Type: Rectangle
All of the Generic Measurement Properties and Methods apply.
| Name | Contents | Example | Notes |
|
Height |
Rectangle Measurement results: Height and Width of Fitted Rectangle |
>>> a=prosem[0][0][0] |
Height and Width are in user units. |
|
Rotation |
Rectangle Measurement results: Angle of Rotation of Long Axis from Vertical axis. |
>>> a.Rotation |
Rotation is in degrees from vertical(!) |
|
Area |
The area bounded by the traced shape, and by the fitted rectangle |
>>> a.Area |
In square user units, nm2 or um2
|
|
CenterX |
Center of the fitted rectangle, in user units (nm or um), with the origin at the image lower-left corner |
>>> a.CenterX |
In user units, nm or um, with the origin at the image lower-left corner
|
Feature Type: Triangle
All of the Generic Measurement Properties and Methods apply.
| Name | Contents | Example | Notes |
|
EdgeLength1 |
Triangle Measurement results: |
>>> a=prosem[0][0][0] |
In user units, nm or um
|
|
InteriorAngle1 |
Triangle Measurement results: The interior angle of the each of the three sides of the fitted triangle |
>>> a.InteriorAngle1 |
In degrees
|
|
EdgeAngle1 |
Triangle Measurement results: The angle of each of the three sides of the fitted triangle |
>>> a.EdgeAngle1 |
In degrees, with respect to the horizontal axis, positive X = 0 degrees
|
|
Area Fitted Area |
The area bounded by the traced shape, and by the fitted triangle |
>>> a.Area |
In square user units, nm2 or um2
|
|
CenterX |
Center of the fitted triangle, in user units (nm or um), with the origin at the image lower-left corner |
>>> a.CenterX |
In user units, nm or um
|
Feature Type: Single Edge
All of the Generic Measurement Properties and Methods apply.
| Name | Contents | Example | Notes |
|
Angle |
The angle of the fitted line of the Single Edge, with respect to the Horizontal Axis |
>>> a=prosem[0][0][0] |
In degrees, with respect to the horizontal axis, positive X = 0 degrees |
|
CenterX |
Center of the fitted single-line |
>>> a.CenterX |
In user units, nm or um, with the origin at the image lower-left corner
|
| LER3StdDev LERCorrelationLengthXi LERRoughnessExponentAlpha |
The Line Edge Roughness measurement results for the single edge
|
>>> a.LER3StdDev |
In user units, nm or um
Only available when LER has been measured for the feature
|
Feature Type: Shape
All of the Generic Measurement Properties and Methods apply.
| Name | Contents | Example | Notes |
|
Area |
The area bounded by the traced shape |
>>> a=prosem[0][0][0] |
In square user units, nm2 or um2 |
|
CenterX |
Center of the shape |
>>> a.CenterX |
In user units (nm or um), with the origin at the image lower-left corner |
Feature Type: Multi-Edge
Multi-Edge is an Advanced Feature Type, with more complexity and capability than the basic feature types above. As the name "Multi-Edge" suggest, this feature can have any number of edges, with any number of measurements defined between the edges. In the data representation, a Multi-Edge feature appears as a Group of SingleEdge features.
For example, at the Group level, a Multi-Edge feature has type GMetrologyMultiEdge, and the size of the group is the number of edges defined within that Multi-Edge feature. Since Multi-Edge measurements are defined as ProSEM variables, they are accessed as properties of the measurement. The compute_cd method can also be used to report the cd between any two edges in a feature.
>>> type(prosem[0][0])
<class 'ProSEMpy.GMetrologyMultiEdge'>
>>> type(prosem[0][0][0])
<class 'ProSEMpy.GMetrologySingleEdge'>
>>> len(prosem[0][0])
3

>>> prosem[0][0].SourceToGate
346.54015736912385
>>> prosem[0][0].GateWidth
440.4669029693961
>>> prosem[0][0][0].GateWidth
440.4669029693961

>>> prosem[0][0][0].compute_cd(prosem[0][0][0],prosem[0][0][1])
346.54015736912385
All of the Generic Measurement Properties and Methods apply.
| Name | Contents | Example | Notes |
|
Angle |
The angle of the fitted line of the Single Edge, with respect to the Horizontal Axis |
>>> a=prosem[0][0][0] |
In degrees, with respect to the horizontal axis, positive X = 0 degrees |
|
CenterX |
Center of the fitted single-line |
>>> a.CenterX |
In user units, nm or um, with the origin at the image lower-left corner
|
| LER3StdDev LERCorrelationLengthXi LERRoughnessExponentAlpha |
The Line Edge Roughness measurement results for the single edge
|
>>> a.LER3StdDev |
In user units, nm or um
Only available when LER has been measured for the feature
|