
Analyzing Circle Size Uniformity
Summary:
ProSEM is used to analyze the size uniformity of arrays of circles, looking for size differences by position within an SEM image, averaged over mulitple images.
Demonstrates:
- Find Similar Features, to find all similar circles within each image
- User Variables, to identify the position of each dot within each image
- Summary Tables, to summarize the dot dimensions in different manners
Demonstrates:
- Find Similar Features, to find all similar circles within each image
- User Variables, to identify the position of each dot within each image
- Summary Tables, to summarize the dot dimensions in different manners
Example:
- Start by loading the image set into ProSEM. In this example, there are four images of dot arrays.
- Setup a measurement of one dot on one representative image. Set the feature type to Circle, and draw the ROI around one of the dots.

- Use the "Find Similar Features" button to locate all dots in this image.

Identifying Measurements with a User Variable
- In the Variables panel, use the Create New Variable... button to define a new variable, in this example called Location. Then step through each dot and assign a value for the location. For this study, dots are categorized as: Corner, Edge, or Inner, depending on their position in the image. (Hint: There are more Edge dots than the other two categories, so you can save a bit of work by assigning "Edge" as the optional Default Value, and then just changing the value for the Corner and Inner dots.)

- Repeat this measurement for other images in the set.
- When all measurements are completed, View the results in the Circle & Elipses Table tab. The values for the user variable named Location can also be edited within this table.

Using a Summary Table
This is a lot of data, but a Summary Table can be used to explore the data quickly and easily.
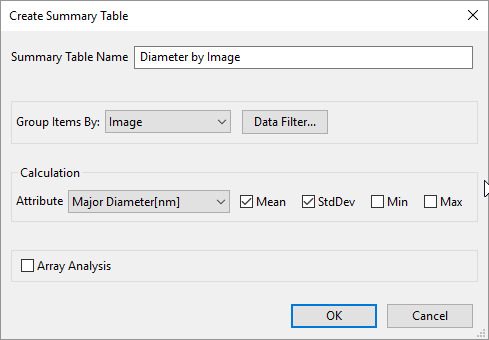
- In the Data Table Toolbar, click the Create Summary Table icon. In the dialog, define what sort of summary to create. First, look at the average dot diameter for each image. For this, select to Group Items by: to Image, and choose the Calculation Attribute to compute using the Major Diameter. By default the Mean and Standard Deviation will be computed for each group, in this case for each image. Optionally, check the Min or Max options to compute those values as well.
When OK is clicked, a new Table will be created with the provided name, in this example "Diameter by Image". This table will contain one line for each unique value of the chosen Grouping Item. Since "Image" was the selected Grouping Item, there will be one line for each measured image file. Each line will contain the number of measurements, and then the Mean and Standard Deviation of the selected attribute, Major Diameter in this example.

Another Summary Table, using the User Variable
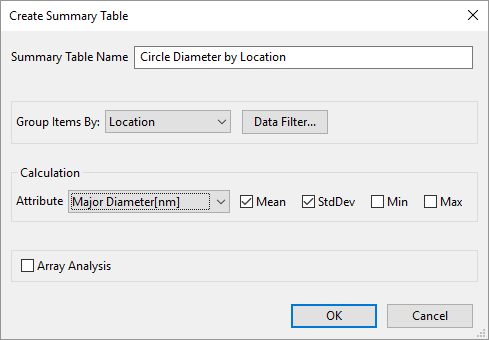
To consider the dot diameter as a function of location within the SEM image, create another Summary Table, but now using the User Variable named Location as the Grouping Item, still considering the Major Diameter as the attribute.
And now the created Summary Table shows that there is a small but perceptible difference in the measured dot diameter depending on the location within the SEM scan field.(Whether these differences are of statistical significance is beyond the scope of ProSEM’s analysis, but the measurement data table could be easily exported for import into a statistics package for more advanced analysis such as ANOVA.)