Scripts - Exporting Measurement Data
Summary:
From ProSEM's UI, Data Tables and Summary Tables can be exported as csv files. Using scripts, data can be exported in custom formats, for interfacing with other systems such as factory automation or data analysis programs.
Demonstrates:
- Exporting measurement data from scripts
- File formats including plain text and xlsx spreadsheet files
- Exported data including measurements, variables, and image metadata
Demonstration Script #1: Export Custom Measurement Data as Text File
This script shows how measurement data can be exported into plain text files. It is setup to demonstrate linewidth measurements such as transistor gate width measurements on multiple wafers. The WaferID is extracted from the image filename, and the date of the SEM image is extracted from the image metadata.
Example Output:
WaferID    MeasDate      CD         StdDev
N5A032     2020/02/01    482.40     5.66
N5A032     2020/02/01    440.74     5.66
N5A032     2020/02/01    418.84     5.27
N5A032     2020/02/01    498.36     5.65
N5A038     2020/02/02    492.36     5.84
N5A038     2020/02/02    503.45     5.74
...
As written, the script will not run on most project data, as it is looking for the wafer id and measurement date in specific formats. But this script can be used as a starting point for your own custom export scripts.
with open(outputDataFile, 'w') as f:
        print ('Writing data to file: {}'.format(outputDataFile))
        f.write(' WaferID    MeasDate      CD        StdDev\n')             # Header Line
        for image in prosem:
            for group in image:
                for item in group:
                    if (isinstance(item,GMetrologyLinesSpaces)):
                        try:
                            f.write('{id:>8}  {dat:>10}  {cd:>8.2f}  {std:>8.2f}\n'.format(id=item.WaferID, dat=image.metadata.get('$CM_DATE'), cd=item.CDMean, std=item.CDStdDev))
                        except:
                            print('Error getting information for measurement: {} :: {} :: {}'.format(image.label, group.label, item.label))
The core of the script code:
- Contains a typical Python
withconstruct for opening a file for writing - Outputs a header line with labels for the data columns
- Uses a typical triple-nested loop structure for looping through all measurements in all groups in all images in the project.
- For each measurement which is a
LineSpacemeasurement, output a line of formatted text to the output file- The
WaferIDin this example must be a variable in the project. Variables are accessed from scripts as properties of the measurement, that is:item.WaferIDin this example - The date the SEM image was taken is extracted from the image metadata. Note that metadata is a property of the image file itself, not of the individual measurement,
so is accessed withimage.metadata.get('keyword'). The metadata keywords are specific for each SEM vendor and model;
one convenient way to see the available metadata for an image is ProSEM's Image Information panel, which lists all available metadata keys and values. - The CD mean and standard deviation are simple measurement properties.
- The
- If any of the data is not available, an error message is output to the console window
Demonstration Script #2: Custom Export Measurement Data as xlsx Spreadsheet File
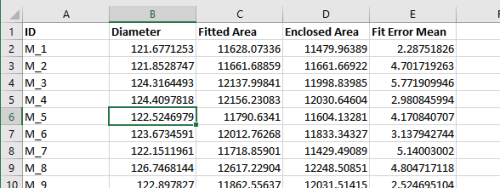
This script shows measurement data exported into a file in xlsx format, which can be opened directly by spreadsheet programs such as Microsoft Excel. This file format is written using a 3rd-party library included with ProSEM's Python instance, so no installation or configuration is necessary by the user to use this library.
As written, this script will not run on most project data, as it is looking specifically for circle measurements, but this script can be used as a starting point for your own custom export scripts.
Example Output:

# Create an new Excel file and add a worksheet.
    workbook = xlsxwriter.Workbook(outputDataFile)
    worksheet = workbook.add_worksheet('Data')
    # Add a bold format to use to highlight the column labels.
    bold = workbook.add_format({'bold': True})
    # we need to keep track of where we are writing into the spreadsheet, and we'll start at the upper left corner.
    row = 0
    col = 0
    # In the first row, write the column headings
    worksheet.write(row,col,"ID",bold)
    worksheet.write(row,col+1,"Diameter",bold)
    worksheet.write(row,col+2,"Fitted Area",bold)
    worksheet.write(row,col+3,"Enclosed Area",bold)
    worksheet.write(row,col+4,"Fit Error Mean",bold)
    row += 1
    for image in prosem:
        for group in image:
            for item in group:
                if (isinstance(item,GMetrologyCircle)):
                    try:
                        worksheet.write(row,0,item.label)
                        worksheet.write(row,1,item.MajorDiameter)
                        worksheet.write(row,2,item.FittedArea)
                        worksheet.write(row,3,item.Area)
                        worksheet.write(row,4,item.FitErrorMean)
                        row += 1
                        print(".",end='',flush=True)    # print a dot to the console as a progress indicator
                    except:
                        print('Error getting information for measurement: {} :: {} :: {}'.format(image.label, group.label, item.label))
    print('\n')
    workbook.close()
This code snippet shows the core of the file export using the XlsxWriter library, which is included with ProSEM. This library is quite simple to use, yet has many powerful options should you need.
