
Measuring L-Bars
Summary:
Sets of line/space patterns at right angles, called "L-Bars", are a common test pattern geometry in lithography. In ProSEM, these can be measured as two line/space gratings.
Demonstrates:
- Grating measurements
- Multiple Groups
Measurement Example:
To start an L-Bar measurement first setup a measurement of a single line of one of two gratings - in this example, starting with the horizontal line (1). For this sort of measurement, the Region of Interest (ROI) should generally be defined as just a bit larger than the largest expected feature to be found.
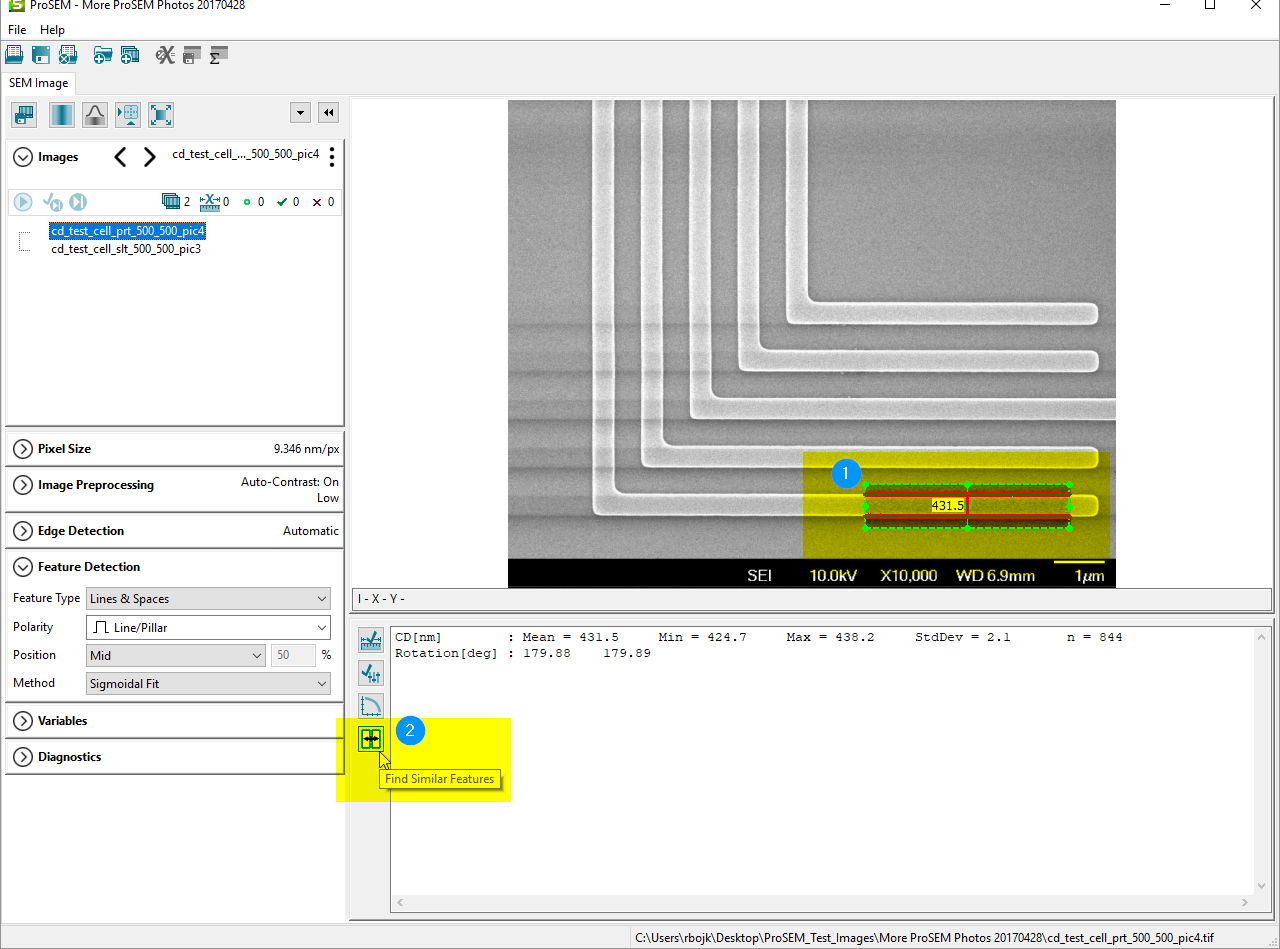
Next click the "Find Similar Features" button -- at the bottom of the Results Toolbar (2). ProSEM finds the other elements of the grating.
After finding the similar features, ProSEM then fits the grating, and reports the grating measurements. When a "Group" label is selected in the Images tree (3), the information displayed in the results area (4) is for that group.

To examine any individual line measurement in the grating, select that line element, by clicking on either the element name in the image tree or on the element border in the image. When an individual element is selected, the specifics of that selected element are shown in the results area.
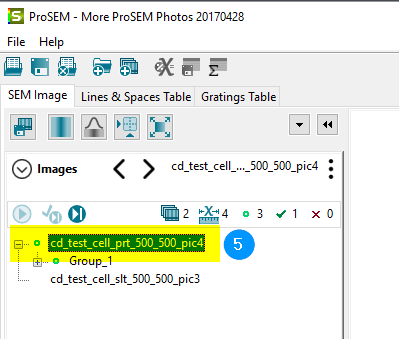
Next, to measure the vertical lines, a new group will be needed. To begin this, first click on the image filename in the Images tree (5). If a group label is selected in the Images tree, manipulations in the image area will act on that selected group; to create a new measurement, the image itself must be selected.
The measurement of a vertical line can be created in several ways:
- While holding down the shift key, click the mouse at one corner of the desired Region of Interest for the new measurement, in this case on the vertical line, then drag the mouse to the opposite corner and release.
- Alternatively, the default ROI, shown in the bright green, can be repositioned to be in the desired location, size and shape, by dragging the entire box and then adjusting the corners or edges.
When the measurement on the vertical line is satisfactory, click the "Find Similar Features" button again, and ProSEM will find a grating of the vertical lines.

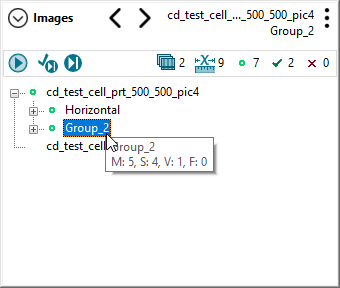
When the image file name is selected in the Images tree, both gratings are displayed. If either individual grating is selected, only that grating and its elements are displayed.

For clarity or later data analysis, the Group names can be changed by clicking on the group name, pause, then second click, just as renaming a file in the Windows explorer. In this way, the groups could be renamed to Horizontal and Vertical, for example.
Data Tables
The Gratings Table tab will show information about the gratings - in this example there are two lines, one for the horizontal and another for the vertical grating.

The Lines & Spaces Table tab will show details about each line measured in all gratings.

Additional Analysis Topics
In the Gratings Table above, it might be interesting to note that the pitch, or period, of the horizontal and vertical gratings are different, 938.7 and 947.4 respectively. Why might this be? In principle, it's impossible to know for certain, but some reasonable assumptions can sometimes be made. In this example, the gratings are written by direct-write electron beam lithography from a high-end machine with the beam position and deflection calibrated with a laser interferometer to a high accuracy, so the difference, as well as the difference from the design size, is almost certainly due to scan scaling non-uniformities in the SEM itself, rather than the source lithography. Such inaccuracies and anisotropies are not uncommon in laboratory SEM instruments, with their very wide range of imaging variables and conditions. Substrate materials can also affect scaling and positioning accuracy, though electrical charging on semi-insulating materials, or magnetic effects on some materials.
In ProSEM, the image scaling can be set based on the measurements of a grating feature, since we believe the grating pitch to be accurate in this case. Select the grating to be the reference, then in the Pixel Size panel, select the "From Current Measurement" option. Replace the measured pitch of the grating, 942 nm in this example, with the known pitch of the grating, 1000 nm in this example. ProSEM recalculates all measurements in this image.

After the recalculation, the Gratings table now shows the pitch of the reference grating to be the defined value, with all other values scaling appropriately. The other grating has the same relative scaling error as before, about 1% in this example.
