Measuring Linewidth versus Dose
Overview:
ProSEM can help make fast work of a common linewidth versus dose calibration. In this example, a set images of trench features exposed using different exposure doses is measured, producing a Linewidth vs Dose process characterization.
Demonstrates:
- Batch measurement, to measure the same feature automatically in all images in a project
- User-Defined Variable, to label each image with its exposure dose value
- Validation Status, to identify which automatic measurements have been reviewed for validity by the user
Example:
- The set of images to be measured is loaded into ProSEM. In this short example, there is just one image at each of four exposure doses, and the center trench feature in each image will be measured.
- A first measurement is setup on a representative image. ProSEM's pattern matching works best when the starting template feature is the largest feature size in the image set. For this example, the ROI box was expanded in the vertical direction to capture much of the length of the trench, and the Feature Detection Polarity was set to Trench. After the first measurement is satisfactory, this measurement is stored using the Store Measurement Results button. The template measurement to be used by the Batch measurement must be a stored measurement before the Batch process can be started.

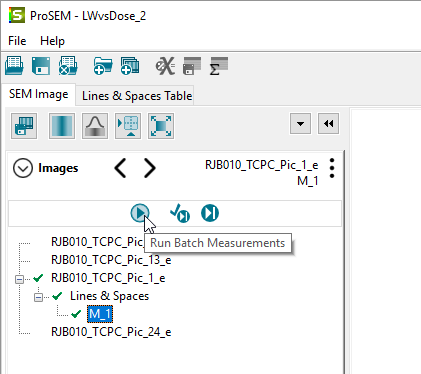
- In the image tree, the template measurement which was just stored is selected. This defines which measurement will be matched during the batch operation. The batch measurement is started by a click on the “Run Batch Measurements” button, in the Batch toolbar in the Images panel. ProSEM will then step through each image.
- After ProSEM has completed the batch measurement, ProSEM has features to allow easy review of each measurement. This step is optional, but is recommended, as ProSEM may not always measure each different image optimally, depending on the variation in the images and features themselves. During the image review, each measurement can also be tagged with a value of the exposure dose used; this value will be stored in a user-defined variable.
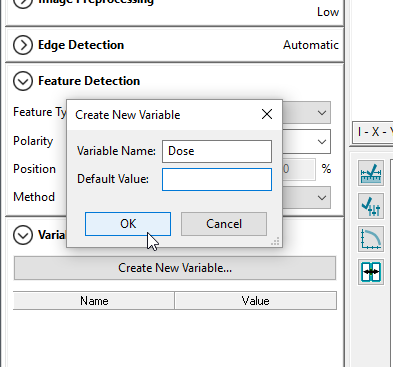
- To use a variable, it must first be created in the Variables Panel, by clicking on the Create Variable button, then assigning a name for the new variable. In this case, the variable is sensibly named: Dose. The Default Value is left blank, so the Dose variable will not have a value unless it is defined for each measurement.
- The first measurement is selected in the tree, and the dose value for this measurement is entered into the Value field for Dose in the Variables panel. In this example, the dose values have been labeled in each image using the SEM's text labeling capability, but they might also come from a lab notebook, process documentation, or perhaps encoded in the filename. ProSEM can use a formula to parse variable values encoded within filenames directly into variable values. That is demonstrated in other examples.

- If the measurement is good, the "Set Validated, Next" button will set the status of this measurement to "Validated", then move to display the next measurement. For each image in this example, there are two tasks:
- Verify the measurement looks good – that ProSEM correctly located and measured the desired feature. Sometimes, it might be necessary to adjust the measurement – this depends on the feature and image quality variation within the set of images. The position of the box can be adjusted easily. For best consistency, it is best to avoid changing measurement options such as position, edge detection method or image preprocessing options for just some measurements within a batch.
If it is necessary to adjust a measurement, first make sure the measurement is selected in the Images panel, then adjust the measurement, then Store the updated measurement using the Store Measurement Results button to update the earlier stored measurement.
Use of the Validation status for measurements is optional - ProSEM will report the measurements whether the measurements have been reviewed or not, but validation is recommended to ensure the most consistent results.
- The value of the Dose variable is assigned to each measurement during the review process. These could also be assigned later, but since the dose values are in each image, in this example it seems easiest to enter the dose values at the same time as image validation.

- After all measurements have been validated and had dose values assigned, the measurement data for the whole batch can be viewed by selecting the “Lines & Spaces Table” tab. From here, the data can be reviewed in a single view, and can be exported into a .csv file, which can then easily be opened in data plotting or analysis programs, such as Microsoft Excel.
It is also possible to fill in or edit variable values in the data table. In this example, the values of Dose for each measurement can be assigned or changed here.

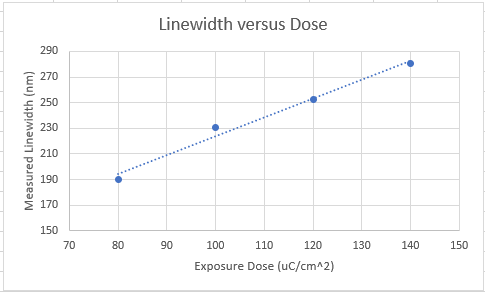
This graph is an example Linewidth versus Dose plot for this data, in this case drawn in Microsoft Excel. In the future, plotting should be possible directly within ProSEM.