
Formulas 5 - Field Stitch and Layer Overlay Measurement
Summary:
This example shows an advanced application of ProSEM Formulas, measuring field-to-field stitching error or layer-to-layer overlay error, an important metric of lithography processes. If you are not familiar with the basics of formulas, it may be useful to first read the prior examples demonstrating formulas.
A typical use for this stitch formula is to measure a set of SEM images captured at different locations, with the output being one X and one Y stitch error measurement for each image / location, so this example will utilize ProSEM's Recipe and Summary Table features as well, to provide an automated measurement and data summary.
A package is available for this application example which contains sample images and necessary formulas scripts, as well as a ProSEM Recipe and a completed ProSEM Project. This package can be downloaded here:
Demonstrates:
- Advanced formula usage, calculations involving individual edges in different object in different groups
- Creating a summary table
- Recipe creation and usage
Note: ProSEM 2.3.0 or greater is required for these formulas.
Background for Field Stitching Measurement:
There are multiple different patterns and methods of measuring field stitch or layer overlay in lithography, such as verniers or box-in-box structures. There are even dedicated tools available designed specficially for this task. Here, a grating method is used to measure field-to-field stitching using ProSEM.

The stitch measurement is achieved by setting up 4 separate grating measurements, one for each quadrant of the pattern. The formulas will then compute the stitch error by analyzing the four measured gratings.
The scripts in this example require:
- Exactly 4 measured groups, each containing a measured grating.
- The Y measurement gratings (horizontal lines) must be in the top two quadrants, and must have the same number of features measured in each grating.
- The X measurement gratings (vertical lines) must be in the bottom two quadrants, and in the lower left grating, the right-most feature must be measured, and in the lower right grating, the left-most feature must be measured.
Procedure for Setting Up a Stitch/Overlay Measurement using these formulas
- Start with a new ProSEM project, with one or more stitch images loaded into ProSEM.
Setup a single quadrant grating measurement
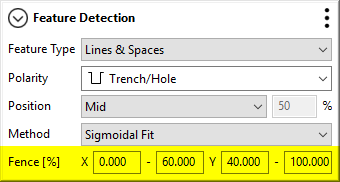
- Setup the first measurement to measure one line of upper left grating. (For the demonstration images provided, change the Feature Detection Polarity to "Trench/Hole".)
A detection fence will define the region of the image in which to search for other members of this grating. In this application using the detection fence causes the find operation to find only the elements in the upper left quadrant, but not those in the upper right quadrant.
- To turn on Use Detection Fence, select that option from the Additional Features menu of the Feature Detection Panel, by clicking on the three dots in the upper right corner.

By default, the fence positions are at the edges of the image.
- Adjust the fence positions by click-and-drag on the fence edge.

Alternatively, the fence positions can be defined by entering the fence positions at the bottom of the Feature Detection panel. The positions are expressed as a percentage of the image, from the lower left corner of the image. In this application, the fences are defined to be somewhat larger than the actual quadrant, to allow for some position shift between SEM images of different stitch/overlay patterns. The detection fence definition is stored with each measured feature.
- Use Find Similar to find the other features in this grating only within this fence region, and create a group of the features in this grating.

Repeat this same setup each of the other 3 quadrants, using these steps for each quadrant:
- Select the Image filename in the Images tree. (This allows creation of new measurement features rather than editing an existing feature.)
- Adjust the measurement box to a feature in the next quadrant
- Adjust the measurement fence positions for the next quadrant to be measured.
- Click Find Similar to find the other features in this quadrant.
When all four quadrants have been measured, the image looks similar to:

Define the Formulas for X and Y stitch measurement
The X stitch and Y stitch errors are measured separately, thus two formulas are required. The formulas are too long to conveniently type, but can be easily imported from the .js javascript files.
See the formula JavaScript for X-Stitch (opens in a new window)
See the formula JavaScript for Y-Stitch (opens in a new window)
- Select a single measurement in any of the 4 measured gratings. Selecting a measurement before editing the formula allows using the Evaluate button to verify the operation of the new formula
- Click the Create New Variable button in the Variables panel
- Enter a name, such as Stitch_X or Stitch_Y
- Select a variable type of Formula
- Click the Import button and then select the corresponding .js file to import
- Check the operation of the imported formula using the Evaluate button
Define a Summary Table
The stitch error is evaluated for every feature in the image; this is the function of formulas within ProSEM. However, due to the definition of the formula, the same value will be calculated for all features in each image. These values can be seen for each meausred line in the Lines & Spaces data table. However, a Summary Table can be used to provide a more convenient table of just the measured stitch error for each image.
- Switch to the Lines & Spaces data table by selecting that tab near the top of the ProSEM window.
- Click Create Summary of the Current Table in the top toolbar.
- Change the table name, if desired.
- For Group Items By, choose Image, so there will be one set of measurements per image.
- For the Calculation Attribute, choose StitchX, and select only Mean for the statistic to summarize. (Because all features in an image measure the same result, the other statistics here have no use.)
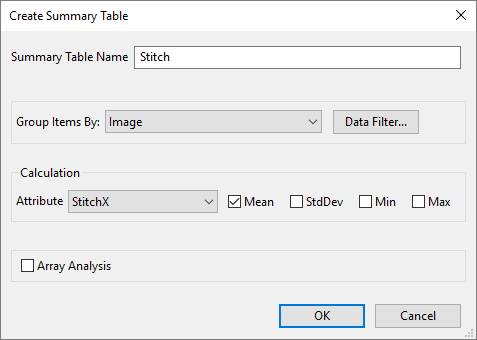
- Click OK
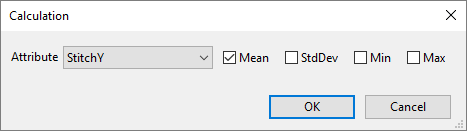
- Cick Add Calculation and now choose StitchY, and again select only the Mean statistic, then click OK.
The Summary Table now shows the X and Y stitch errors for each image, although in this example only one image has been measured.

The Summary Table has been defined here, though, so that the Recipe to be created in the next section will already contain the summary. In that way, the same Recipe can be used on other image sets without the need to seperately add the summary.
Use a Recipe to Measure Other Images
If still viewing a Summary Table, switch back to ProSEM's SEM Image tab.
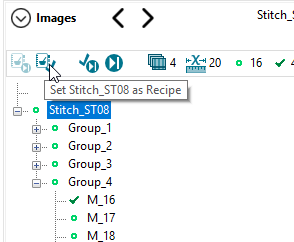
Select the image name in the Images Panel. The image name must be selected so that the recipe to be created will contain all four groups necessary for the stitch measurement.
Click the Set as Recipe button.
With a Recipe define, several actions are possible:
To use this recipe to measure other images in this project:
- Select an image in the Images panel
- Click on Run Recipe, then choose either:
- Run on This Image, or
- Run on All Images Without Measurements
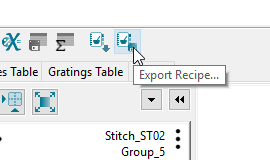
This Recipe can also be Exported for use on other projects of stitch images.
Once this recipe has been successfully run on other images, the resulting summary table looks like:
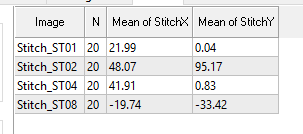
This is the goal of this example - a table of the measured stitch error for each image in the project. This table may be exported into a CSV file.
Troubleshooting
When using these Stitch/Overlay Formulas on multiple images, the degree of automatic success varies. The more the images vary from the template image in position, rotation, brightness, or contrast, the likelihood increases that some manual adjustment will be necessary.
Note the requirements listed above, specifically:
- Each image must have exactly 4 measured groups, each containing a measured grating. If there are any additional groups stored other than these four required groups, those groups should be deleted to obtain a valid stitch/overlay measurement.
- The Y measurement gratings (horizontal lines) must be in the top two quadrants, and must have the same number of features measured in each grating. If the two gratings have a different number of features measured, the formulas cannot calculate the stitch, and an error message is displayed instead.
- The X measurement gratings (vertical lines) must be in the bottom two quadrants, and in the lower left grating, the right-most feature must be measured, and in the lower right grating, the left-most feature must be measured. If these two 'key' features are not mesaured as part of the respective lower-left and lower-right gratings, an erroneous result will be given.
In case the recipe find does not find a feature match for one or more of the feature groups, it may be necessary to manaully adjust any failed measurements, and use Find Similar to find the rest of the grating. In these cases, it will be necessary to manually delete the "Lines & Spaces" group after the four gratings have been found.
In the case that one or more individual features within a grating are not found, it will be necessary to manually adjust the features and manually find and store the missing measurements. Those manual measurements should then be moved into the corresponding grating group in order for the Stitch formulas to function properly.