Measuring Gratings
Summary:
One-Dimensional Line/Space Gratings are common lithographic patterns. ProSEM can measure these gratings and report statistics of the gratings.
Demonstrates:
- Use of Find Similar Features to measure a Line/Space Grating.
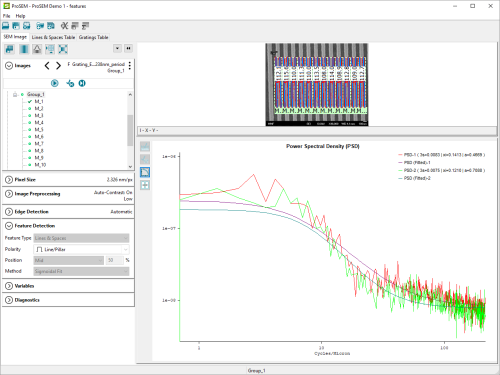
- Line Edge Roughness (LER) measurement and Power Spectral Density display
Measurement Example:
In this example, a grating etched into Indium Phosphide will be measured.
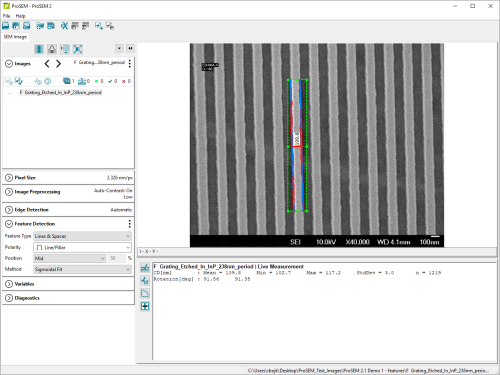
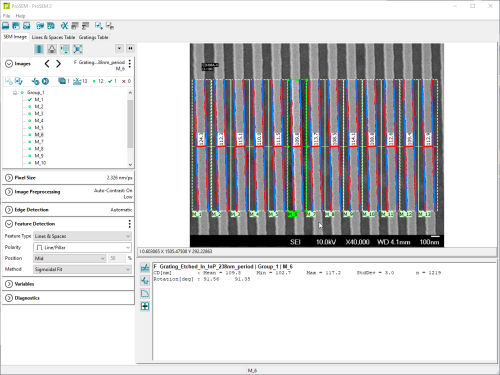
To start, first a measurement of a single line is setup, as shown here:
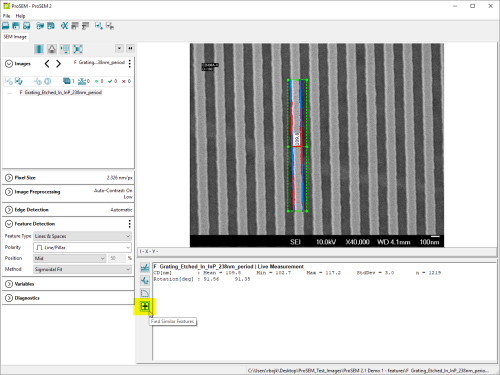
Next the "Find Similar Features" button, found at the bottom of the Results Toolbar, is used to have ProSEM find the other elements of the grating.
After finding the similar features, ProSEM then fits the grating, and reports fitting statistics about the grating. When the "Group_n" label is selected in the Images tree, the information displayed is for the entire grating.
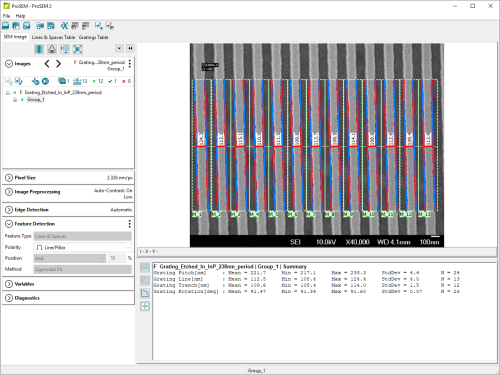
Grating_Etched_In_InP_238nm_period | Group_1 | Summary
Grating Pitch[nm]         : Mean = 221.7 Min = 217.1 Max = 238.3 StdDev = 4.4 N = 24
Grating Line[nm]          : Mean = 112.5 Min = 108.4 Max = 124.4 StdDev = 4.0 N = 13
Grating Trench[nm]        : Mean = 109.6 Min = 108.4 Max = 114.0 StdDev = 1.5 N = 12
Grating Rotation[deg]     : Mean = 91.47 Min = 91.34 Max = 91.60 StdDev = 0.07 N = 26
Any specific individual measurement in the grating can be shown by selecting that element, either in the Image Tree or by clicking on the element in the image (when the cursor changes to a pointing finger). When an individual element is selected, the Results Area shows the specifics of that selected element.
Grating_Etched_In_InP_238nm_period | Group_1 | M_6
CD[nm]            : Mean = 109.8 Min = 102.7 Max = 117.2 StdDev = 3.0 n = 1219
Rotation[deg]     : 91.56 91.35
With a single element in the grating selected:
Line Edge Roughness
When a grating is selected in the Images tree (when the Group_n label is selected), and the Line Edge Roughness button is clicked, the roughness is calculated for each individual line edge as well as the collective length of line in the full grating. By evaluating LER over the longer length of all grating edges combined, a less noisy PSD results.
Data Tables
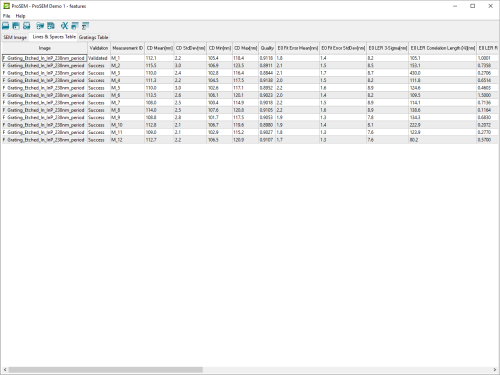
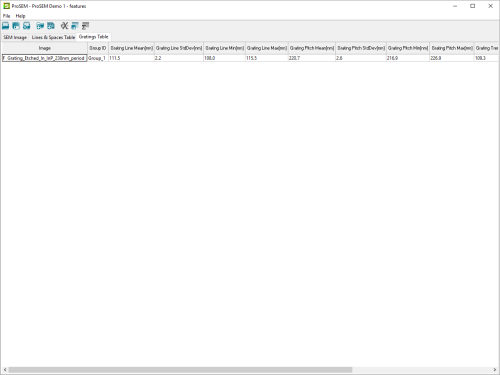
For a grating measurement, each grating group will be output to a line in the Gratings Table, and each individual element will be output to a line in the Lines & Spaces Table, so the full data is always available for review and export.
The Gratings Table for the above grating is shown here:
And here is the Lines & Spaces Table for the grating, showing each individual line in the grating.
