
Scripts - Running the Demonstration Scripts
Summary:
How to run the Demonstration Scripts included with ProSEM
Demonstrates:
- How to run scripts, using demonstration scripts that are included with ProSEM
- Plotting Measurement Data
- Apply Specifications to Measurements
- Building rich reports with tables and plots
There are two demonstrations included with ProSEM. Script operation depends on the details of the images and measurements, so these demonstrations include images and completed ProSEM projects with measurements, to illustrate how scripts can be used.
Demonstration Script #1: Linewidth versus Dose, Plot and Report
This script loads a demonstration project that contains 5 SEM images of resist lines exposed at different doses. The dose is in each filename, so this value is extracted using a formula to provide the dose for each line.
To run the script:
- First close any open project. The script loads its own project, so no project can be open before running the demonstration.
- From the Script menu, choose: examples > demos > linewidth_vs_dose_demo > 1_load_and_plot.py

- The script will launch, in a new terminal window for the Python execution, and then a plot will open in a separate window. The plot is drawn using the matplotlib plotting library which is included in ProSEM's Python distribution.

The icons at the bottom of the matplotlib plot viewer let you save the plot to a file, zoom in, change axes, etc.
You must close the plot window to end the script and return back to interactive ProSEM.
After the script has completed, the temporary demonstration project remains open in ProSEM, so you can examine the implementation. In this example, formulas are used in the Variables panel to extract the relative exposure dose from each image's filename, another variable holds the base dose for the exposure, and then a third formula computes the actual exposure dose for each measured line, with a simple formula multiplying the relative dose by the base dose. The actual Exposure Dose variable is used as the dependent variable plotted on the X-Axis of the plot, with the measured Mean_CD plotted on the Y-Axis.
With the demonstration project still open, you can run the second part of this first demonstration; from the Script menu, choose: examples > demos > linewidth_vs_dose_demo > 2_report.py
This demonstration will create an example of an HTML report. You will be prompted to choose a folder location and filename for the html report. It is recommended that you navigate away from the demonstration folder, and create your report in another convenient location for you, perhaps a temporary folder on your desktop.
The script will generate the necessary report files, then print in the terminal window the location and filename of the report.
When this html file is opened in your web browser, the report content is displayed. This report has a table showing each measured CD, along with a thumbnail of the measured line. These thumbnails are links to the full-size images which open in additional browser windows and let you inspect each measurement. Below the table is the same plot generated in the first example above.

Demonstration Script #2: Load Image, Load and Apply Recipe, Apply Specifications, Plot and Report
This script loads a demonstration project that contains just one SEM image, which contains ~240 rectangles etched into a metal film. There are three scripts in this example:
| Script | Demonstrates |
1_load_and_measure.py |
Loading an image, loading a recipe, and applying that recipe from a script |
2_apply_specs.py |
Asking for user input with a dialog widget, and applying specifications to measurements, setting the status for those measurements that do not meet the specification to "Out Of Spec" |
3_plot_and_report.py |
Generates an HTML report, with a table summarizing measurement statistics, another table of measurement status counts, and then a histogram plot of measurement values |
To run the script:
- First close any open project. The script loads its own project, so no project can be open before running the demonstration.
- From the Script menu, choose:
examples > demos > rectangle_demo > 1_load_and_measure.py
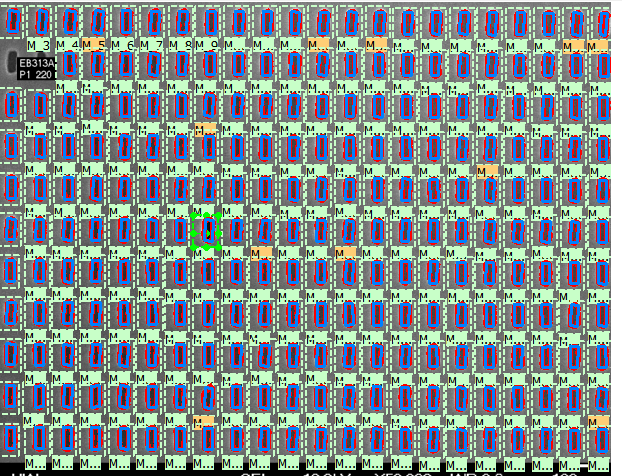
The script loads the image file, loads a stored recipe to measure and fit a rectangle, and then finds all similar rectangles in the image. In the resulting image, one rectangle has the status "Uncertain", as shown by the yellow label. This indicates a questionable feature fit.

If we zoom in on the Uncertain measurement, we see that indeed, this specific rectangle has a defect, and thus a feature fit score that is worse than the other found features. The purpose of the Uncertain status is to draw the user's attention to features needing inspection, so the user does not need to inspect all 240 found features. In this case, the user could:
- Accept this feature and continue with analysis, optionally changing the status to "Validated" to indicate the user has inspected the measurement
- Adjust the measurement, perhaps by adjusting the ROI size or measurement settings, which might be helpful in some cases of mis-measurements, but in this case of an actual defect on the imaged sample, adjusting will not be able to improve the measurement
- Remove the measurement from the analysis, so it is not considered in statistics or plots

The second script in this set starts with the array measurement from the first script, completed and still open. This script first asks the user which specification to apply to the measurements, by using a Dialog Box widget for the user to make a choice:
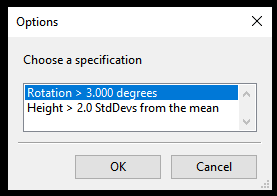
In this example, there are two specifications possible; of course, specification scripts will be completely dependent on the types and sizes of features being measured. Here, the two demonstration specifications are:
- The rotation of the fitted rectangle cannot be more than 3 degrees from vertical
- The height of the rectangle cannot be more than 2 Standard Deviations from the mean height of all rectangles in this image
In either case, any measurement which does not meet the chosen specification will be set to a measurement status of "Out Of Spec", which is displayed in the image view with an orange label.
The third script generates an HTML report, similar to that in the first example above, but with different content. This report contains a measured image, a table summarizing measurement statistics, another table of measurement status counts, and then a histogram plot of measurement values

These demonstration scripts give some ideas for how scripts can be used in ProSEM. Of course, the details all depend on the measurement types and the user's needs. By using python scripting for plotting, specifications, and report generation, the capabilities are extremely powerful, with limitless possibilities.