App Note: SEM Automation
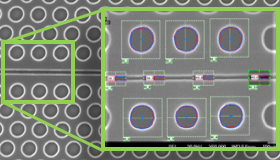
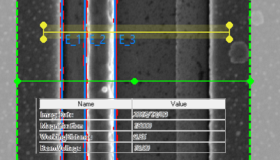
L-Bar Measurements
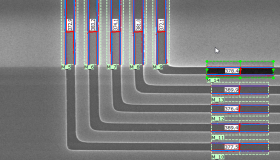
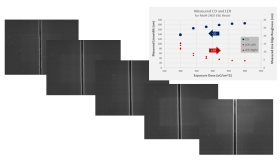
Linewidth versus Dose Measurement
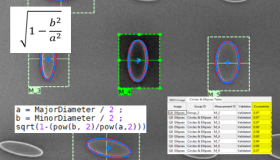
Circle Uniformity
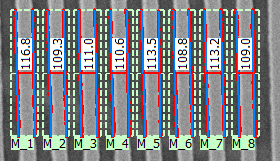
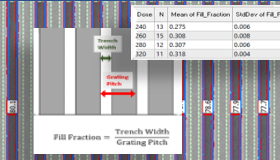
Grating Measurements
Linewidth and Line Edge Roughness versus Dose
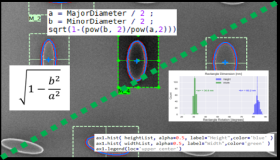
Formulas 1 - Basic Shape Analysis
Formulas 2 - More Advanced Calculations in Groups, Contexts
Formulas 3 - Handling Different Feature Types and Errors
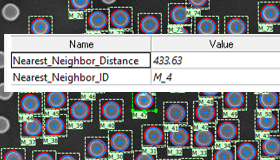
Formulas 4 - Nearest-Neighbor Spacing Between Shapes
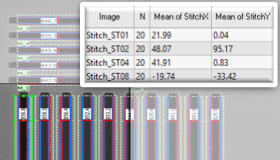
Formulas 5 - Field Stitch and Layer Overlay Measurement
Formula and Script: What's The Difference
Using Image Metadata
Scripts: Running the Demonstration Scripts
Scripts: Using Example Scripts from this Website
Scripts: Reference
Scripts: Exporting Images
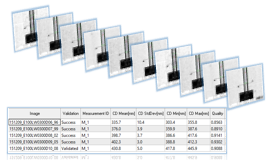
Scripts: Exporting Measurement Data
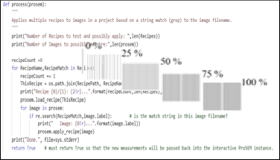
Scripts: Using Multiple Recipes in one Project
Scripts: Plotting Basics
Scripts: Dialogs