Measuring Linewidth and Line Edge Roughness versus Exposure Dose
Summary:
The linewidth and line edge roughness (LER) of a negative e-beam resist are measured as a function of e-beam exposure dose.
Demonstrates:
- Recipe / Batch mode to perform the same measurement on a set of images
- Line Edge Roughness (LER) measurement
- Formula to extract the relative exposure dose from the image filename and compute the absolute exposure dose
- Export to save the measurement data for plotting in an external program
For this negative e-beam resist process, the linewidth varies with exposure dose of course, but from SEM observations it appears the line edge roughness (LER) also varies with dose. Here, ProSEM is used to quantify this observation.


Procedure:
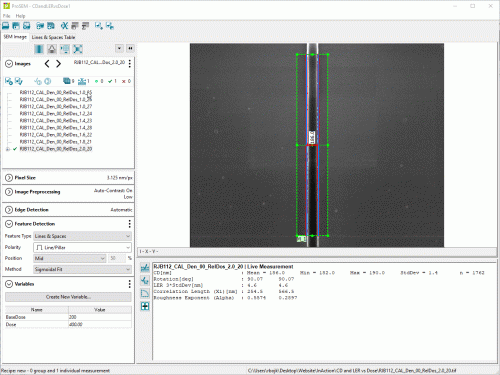
- The set of SEM images with the same line geometry exposed at varying doses is loaded into ProSEM.
- Starting with the widest linewidth (highest exposure dose), a linewidth measurement is setup. The LER of this line is also measured. This measurement is then stored in ProSEM.

- In the Images tree, the image filename with the stored measurement is selected, to indicate this is our chosen template measurement.
- The "Set as Recipe" button then defines this image's measurement(s) as the recipe measurement.
- The Run Recipe button is the clicked, and the option to "Run on all images without measurements" is selected (this option avoids a duplicate measurement on the template image, which has already been measured.)

The image filenames in this project include a relative exposure dose factor, here varying from 1.0 to 2.0. The absolute exposure dose is simply the Base Dose times this Relative Factor. A ProSEM formula is used to extract the relative dose factor from the filename for each measurement, and a ProSEM value variable is defined to store the base dose for the exposure.
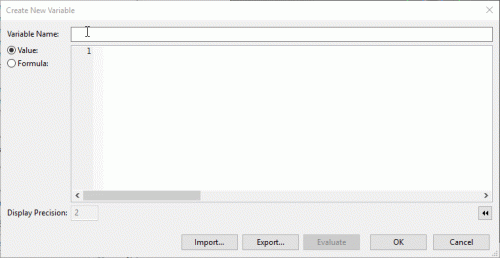
- A variable is defined for the Base Dose. This is a variable with a Value type, as it is simply a numerical value. It will be the same value for all measured features.

- Next, a variable is defined for the absolute Exposure Dose. This is a Formula type variable, and uses a Regular Expression to extract the relative dose from the image filename, then multiplies that Relative Dose by the Base Dose value (the variable just created in the previous step), the result in the Exposure Dose for each measurement.

The formula used here to extract the relative dose and calculate the exposure dose is:
BaseDose * Number(/RelDos_([\d\.]+?)_/.exec(image.label)[1])More details about formulas and Regular Expressions is found in other In Action examples detailing Formula Usage.
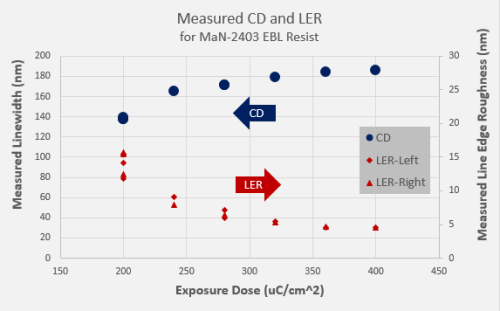
The measurement data, including the dose variables, measured CD and LER values, can be seen by selecting the "Lines & Spaces" Data Table tab. This data can then be exported to a .csv data file using the Export Current Table... button. The data can then be plotted using an external program.

When plotted, it is clearly seen that LER does indeed increase at very low exposure dose values.

