
Formulas 2 - More Advanced Analyses: Groups and Contexts
Summary:
This example shows some additional capabilites of Formulas, which make it possible to extend ProSEM’s analysis capability to report what you need. If you are not familiar with the basics of Formulas, it may be useful to first read the prior example: Formulas 1 - Basic Shape Analysis.
In this example, some properties of gratings involving multiple shapes are computed, as well as demonstration of string handling such as extracting a variable value from the filename. The example also demonstrates using a Recipe, Measurement Validation, and a Summary Table.
Note: ProSEM v2.3.0 or higher is required for the formulas in this example.
Demonstrates:
- More advanced formula usage, including context references and computations between objects
- String processing using RegExp to extract variable values from image filenames
- Using a Recipe to measure all images in a project
- Measurement Validation
- Creating a summary table
Measurement Example: Grating Duty Cycle or Fill Fraction
The goal of this example is compute the Fill Fraction for a set of images which were exposed using a different exposure dose, so the linewidth varies for each image. Formulas are created to compute the Duty Cycle or the Fill Fraction of a grating, accessing the Group properties for each shape. Also the exposure dose for each image is extracted from each image filename using REGEXP string processing, and a Summary Table is used to produce a table of Fill Factor versus Exposure Dose.
The Fill Fraction here is defined as:
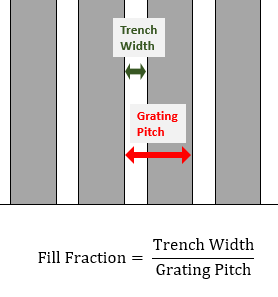
- For this grating measurement, a single trench measurement is setup, then find similar is used to find the other features in the grating.

- The Group heading is selected, and this found Group is then Set as the Current Recipe. This recipe is then applied to all other images in the project as a batch operation.

- After the Batch Measurement using the Recipe has completed measuring all images, the results of each image are manually reviewed and validated. This is an optional step, but is helpful when images vary within a project, by ensuring all finds were successful.

- Next a variable is created to compute the Fill Fraction, defined here as the width of the trench divided by the grating pitch, meaning the fraction of the grating that is trench. The formula is calculated for each trench in the image, however the pitch is not a property of an individual trench measurement. Instead, the grating pitch is a property of the grating or group which is made up of multiple trenches. So to compute the Fill Fraction, the formula needs to access the property of another object, the containing group. To access the property of another object, the path to that object must prepend the property name; in this case: group.GratingPitchMean refers to the mean pitch of the grating containing this measurement being computed. In the Context Browser, this is found by opening the "group" subheading in the Context branch. Another example of this context usage is shown later, where the Exposure Dose is extracted from the Image File Name.

The formula used here for the Fill Fraction is:
CDMean / group.GratingPitchMean- It might be more desirable to display this Fill Fraction value as a percentage, rather than a decimal fraction. To demonstrate displaying the value as a percentage, another variable is created, called Fill_Percentage, with the value:
(Fill_Fraction*100).toFixed(1) + "%"This formula refers to the Fill_Fraction value which was already calculated, and then converts it to a percentage by multiplying by 100. Then, the number is converted to a string with 1 decimal place, and then a percent sign is appended to the string. Note that since this value is now a string rather than a number, so it behaves differently in summary tables; specifically you cannot make numerical statistical calculations on strings -- no average, no standard deviation. However, you can group by string values when creating summary tables, but you cannot group by numerical values. So depending on the usage of the computed value, whether it will be used as a grouping identifier or an item to have statistics computed, it might be necessary to convert the value between a number and a string. The built-in JavaScript methods: toFixed() and Number() are useful for converting numbers to strings or vice-versa.
Example 2: Extracting a value from the image filename
Each grating image file in this example was exposed using a different exposure dose, and that dose is encoded within the filename for each image file. For example, in the filename:ZEP50_200nm_AD300uC_12 the exposure dose is the value between the characters AD and uC, in this case 300 uC/cm2. For the goal of finding the Fill Fraction as a function of Exposure Dose, the dose can be easily extracted from the filename by using a formula. Here, the formula uses a common text processing capabilty called RegExp, short for Regular Expressions. While the syntax is perhaps not intuitive, it is very commonly used throughout the Unix and Linux world, and in common programing languages such as PERL, Python, and JavaScript. Numerous online resources are availble to find the necessary RegExp syntax for a given task.
In this example, the task is to extract the series of digits from between the literal characters "AD" and "uC". This first part of this formula, between the forward slash "/" characters, defines this pattern. \d+ is RegExp syntax for matching "one or more digit", the parentheses surround this indicate this is part of the filename string that is to be extracted, and the literal characters AD and uC indicte the desired string to extract are the digits between those two character strings. That RegExp pattern match is then applied (by the .exec method) to the property image.label, which is the filename of the image containing this meausurement being calculated. Finally, the [1] index extracts only the first grouped value from the regular expression operation, although in this case, there is only one value to be matched.
/AD(\d+)uC/.exec(image.label)[1]When this formula is applied to each measurement in this project, the Exposure Dose is extracted for each measurement. As extracted, the dose is a character string; this will allow the dose to be used as a category for a Summary Table to be created in the next section. The extracted dose can be converted to a numerical value using the JavaScript Number function, for example: Number(Dose) will be a numerical value.
With the Fill_Fraction, Fill_Percentage, and Dose variables defined, the Lines & Spaces Data Table shows the value for each of these variables is computed for all measurements. Formulas are always computed for all measurements.

Creating a Summary Table
While having the fill fraction and dose for each measurement might be useful, it might be desirable to summarize and see the average fill fraction for each exposure dose. That's the function of a Summary Table.
- From the Lines & Spaces Data Table, click the Create Summary Table toolbar icon.
- Summary Table Name: Can be changed, or left as the default
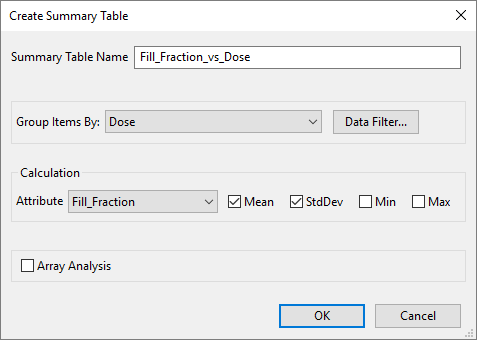
- Group Items By: Dose, because the desired output is the average Fill Fraction for each Dose
- Calculation: Fill_Fraction, to see the average fill fraction for the measurements at each Exposure Dose. The default calculations are the Mean and Standard Deviation of this variable within each grouping.

The settings for this table are:
And when OK is clicked, the summary table is created:
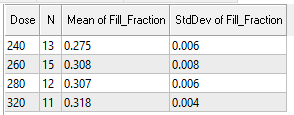
This example demonstrate ProSEM formulas using groups of measured shapes, such as gratings and arrays. See other examples on this site for additional formula usage.